Truly understand your portfolio risks.
Advanced quantitative analysis, multi-factor diagnostics and market projections. Portfolio Tracker goes beyond simple tracking to give you the keys to decision-making.
Identify your risk drivers, recurring crises and your Sharpe gap in minutes.
Everything a tracker should do — done right
Your accounts, your transactions, your assets. Everything is centralized, importable and ready for analysis.
Accounts & transactions
Centralize your accounts (brokerage, retirement, savings…), track contributions, withdrawals and the full history of your operations.
Import & custom assets
Import from CSV or PortfolioPerformance. Add custom assets (real estate, private equity, REITs) with manual pricing.
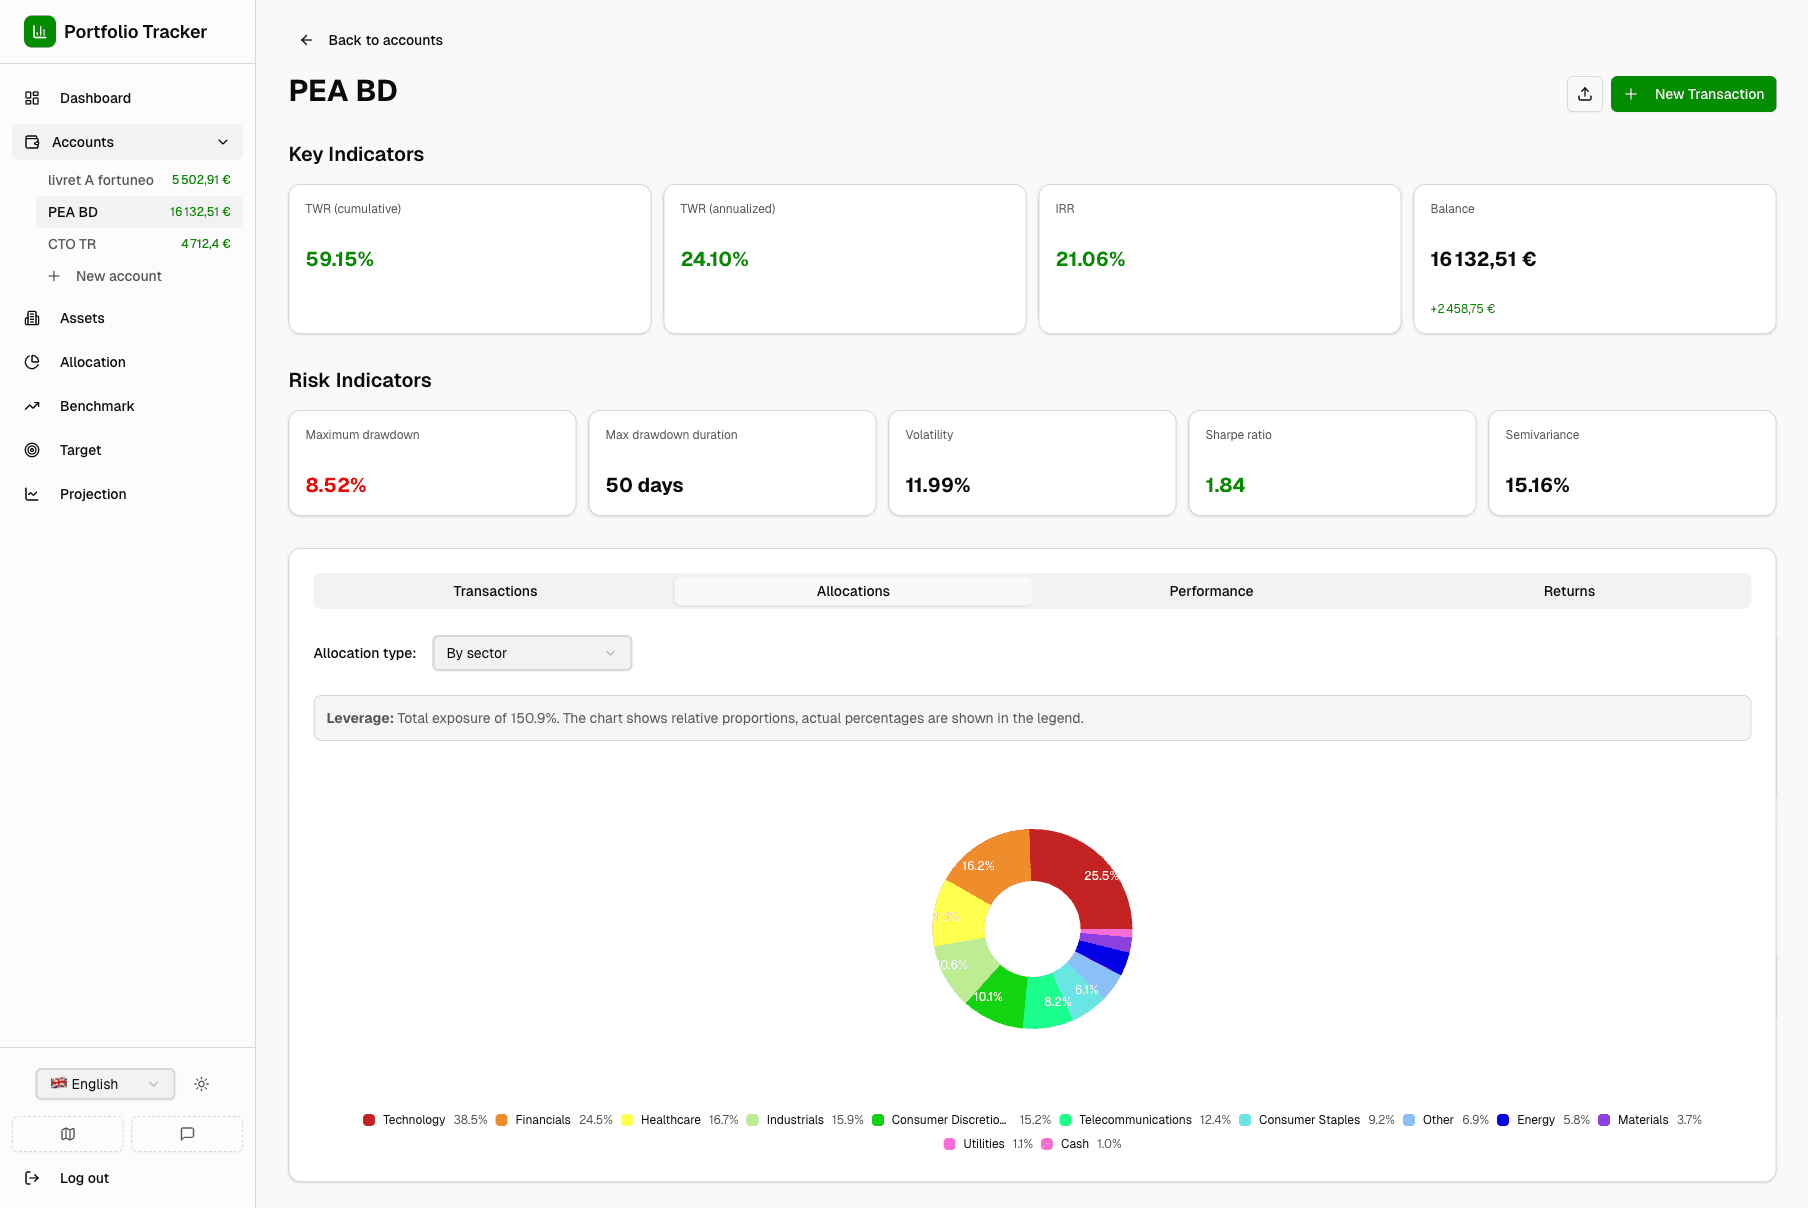
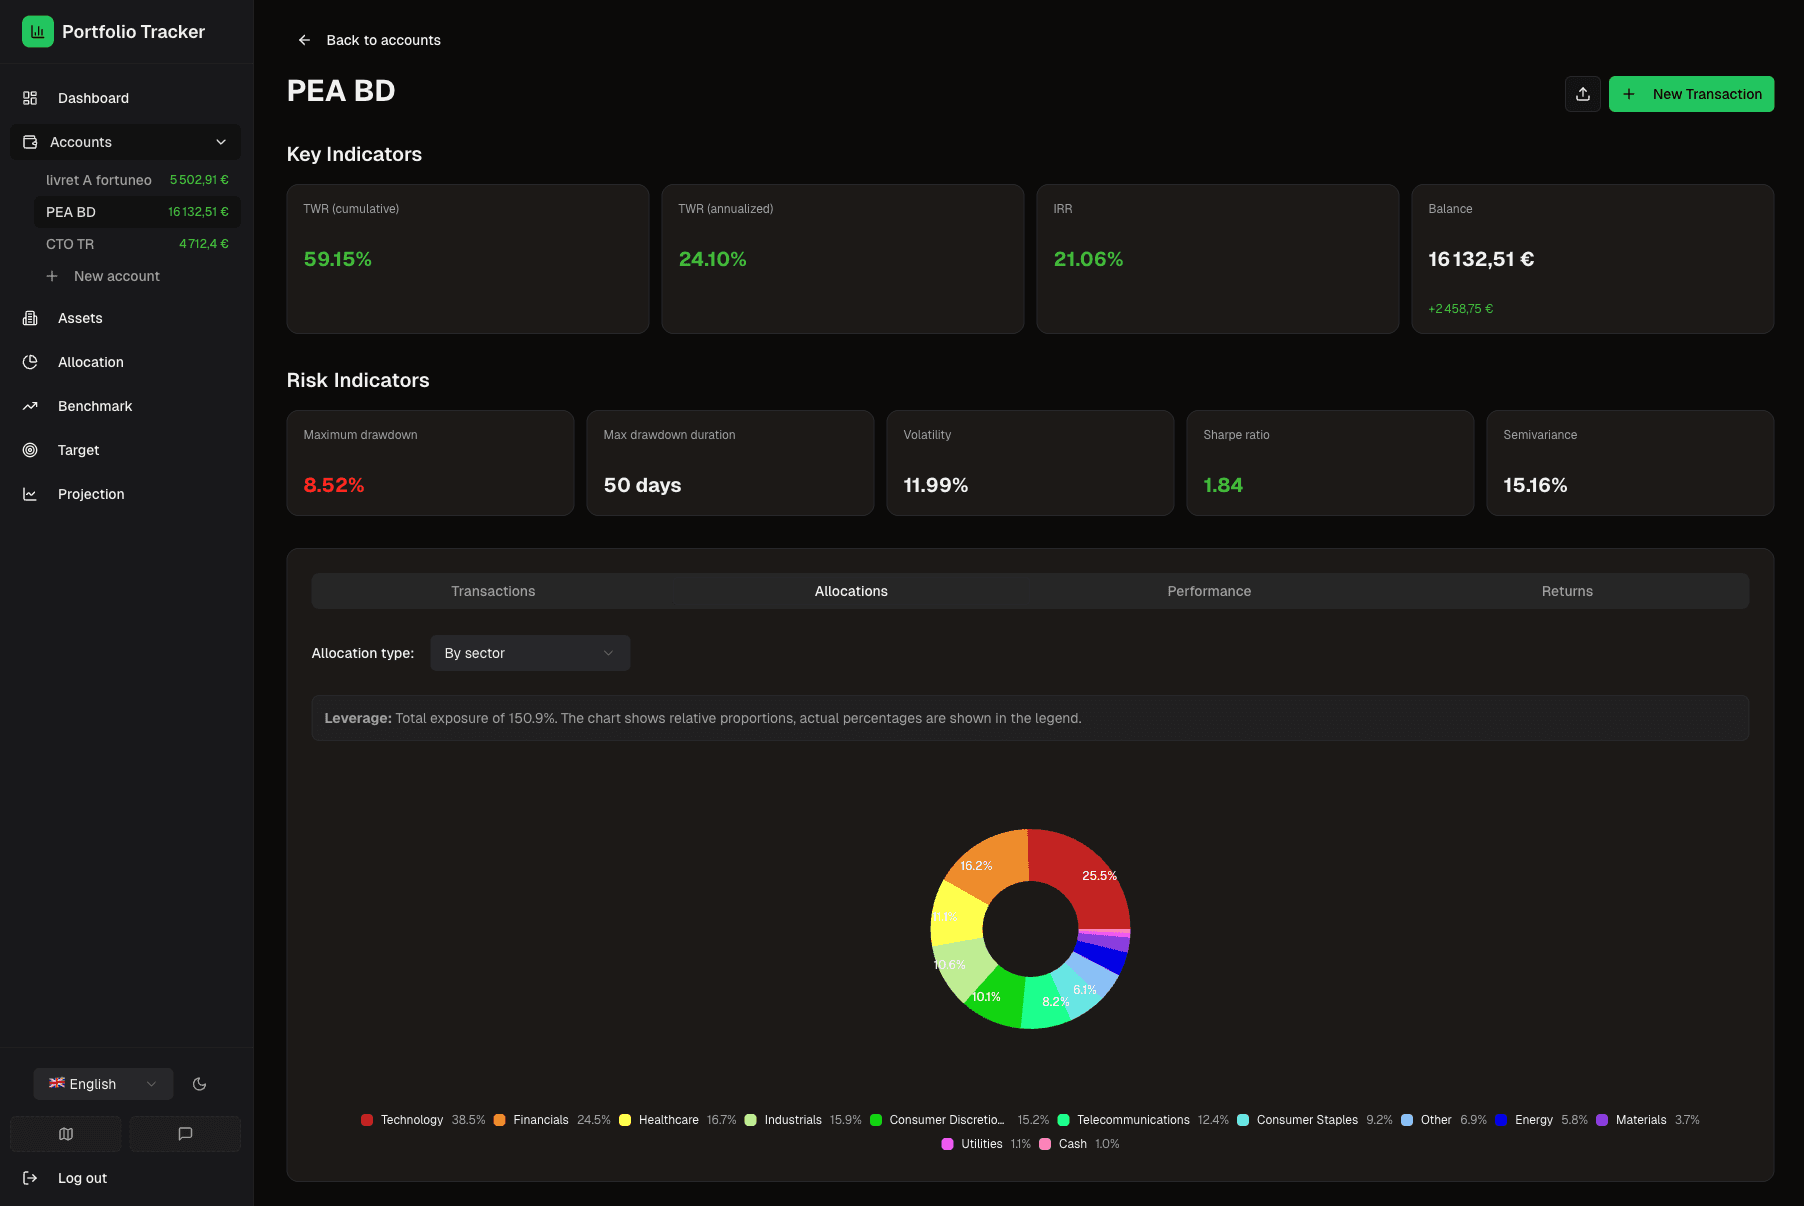
Performance, allocation & benchmark
TWR, IRR, Sharpe, allocation by type/geography/sector, benchmark comparison and risk/return scatter.
A portfolio diagnostic, not just reporting.
Understand why your portfolio behaves this way, not just how.
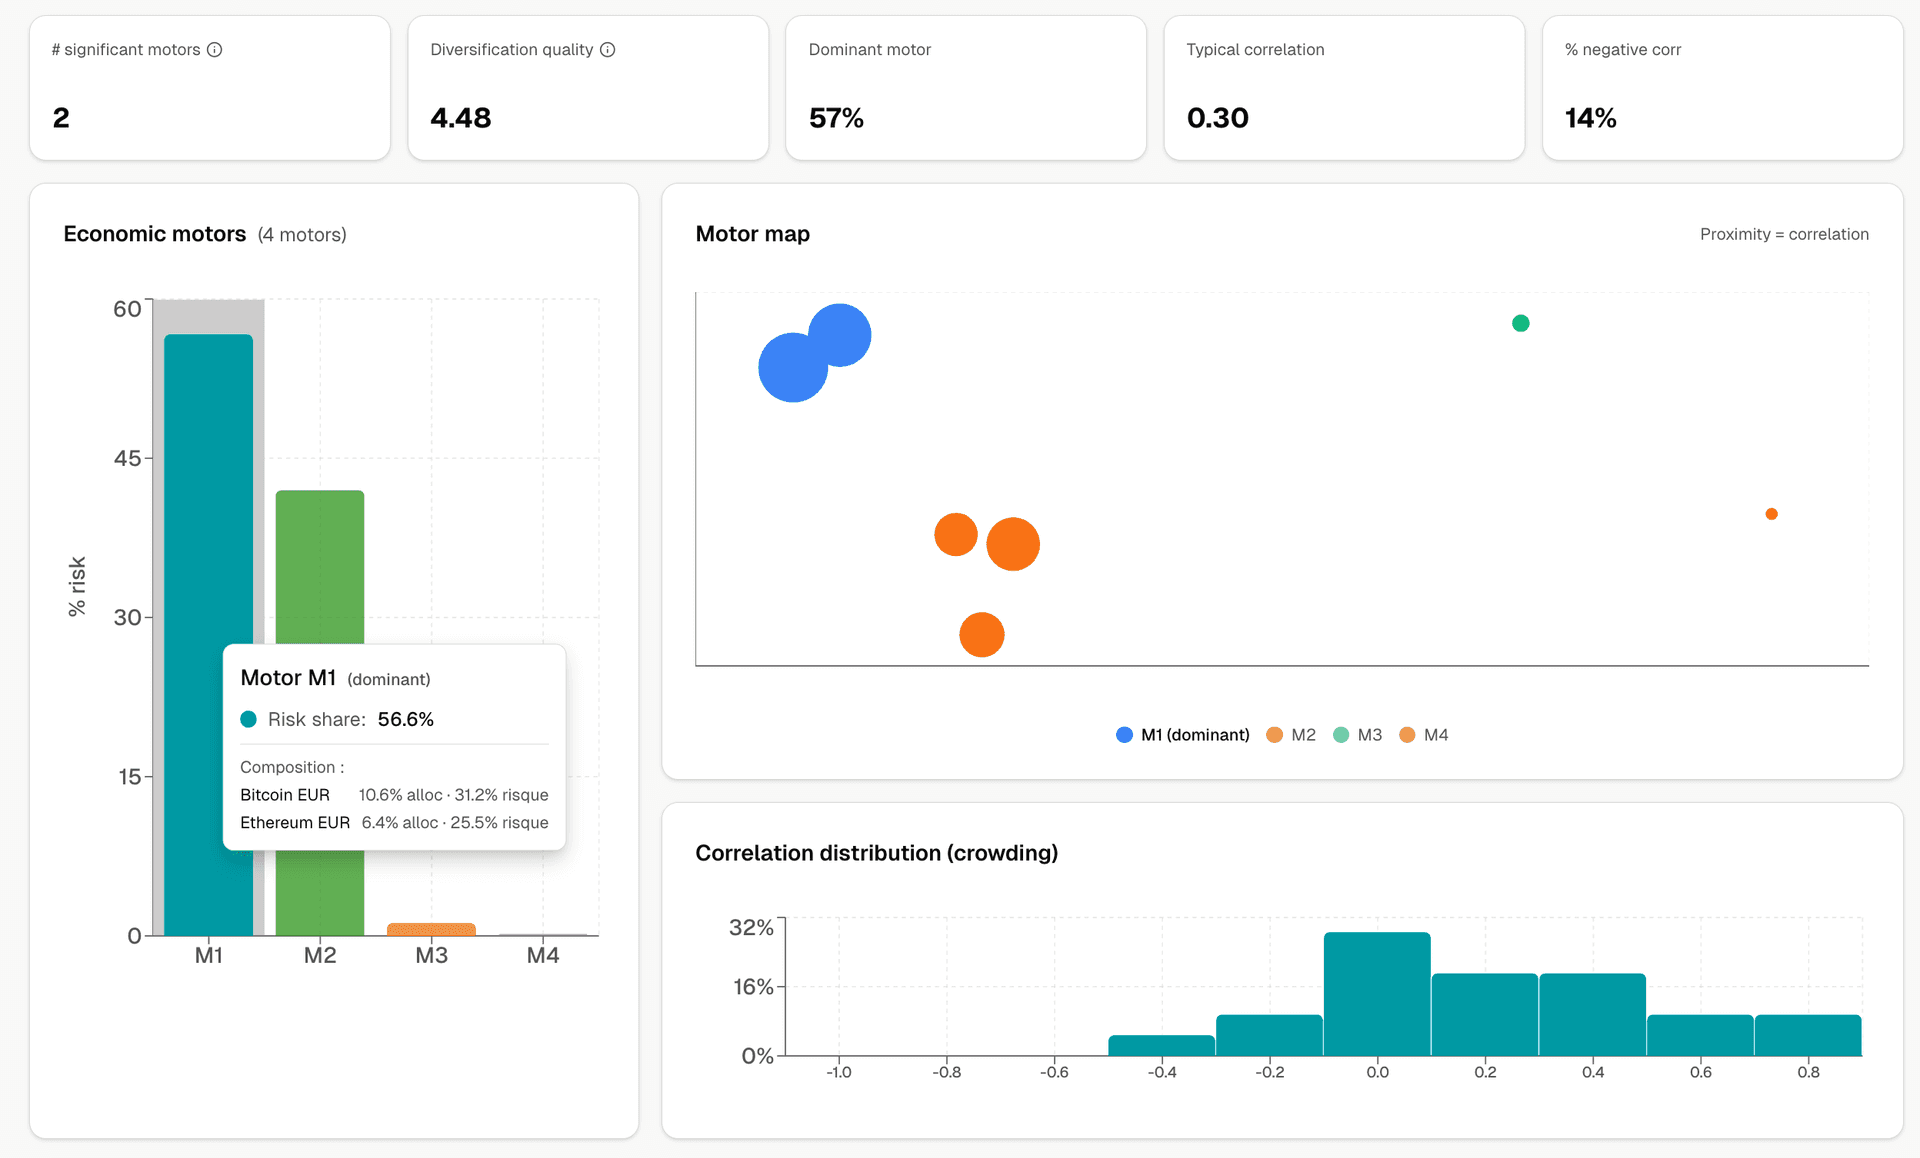
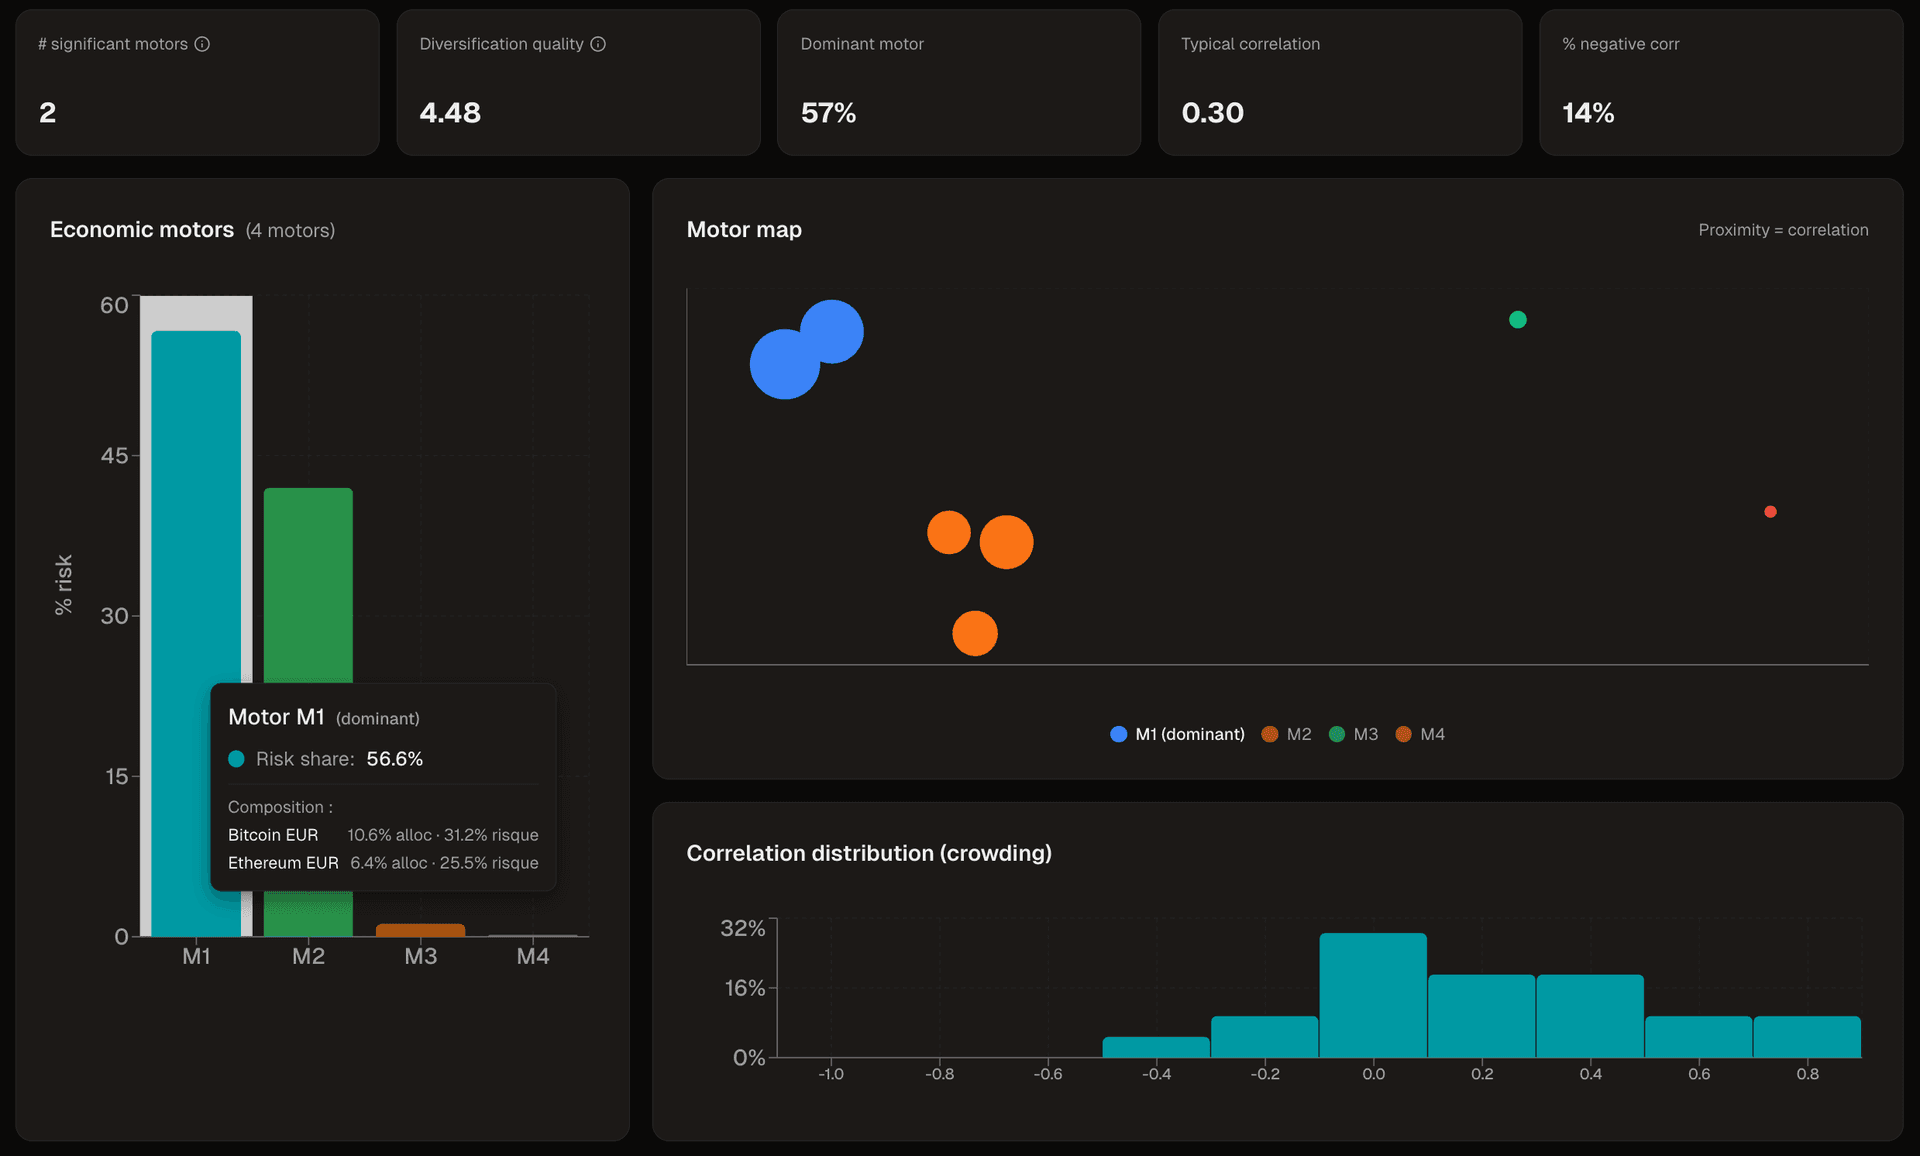
Diversification
your true risk drivers
Identify the real economic drivers of your portfolio. Cluster map, crowding and correlations beyond appearances.
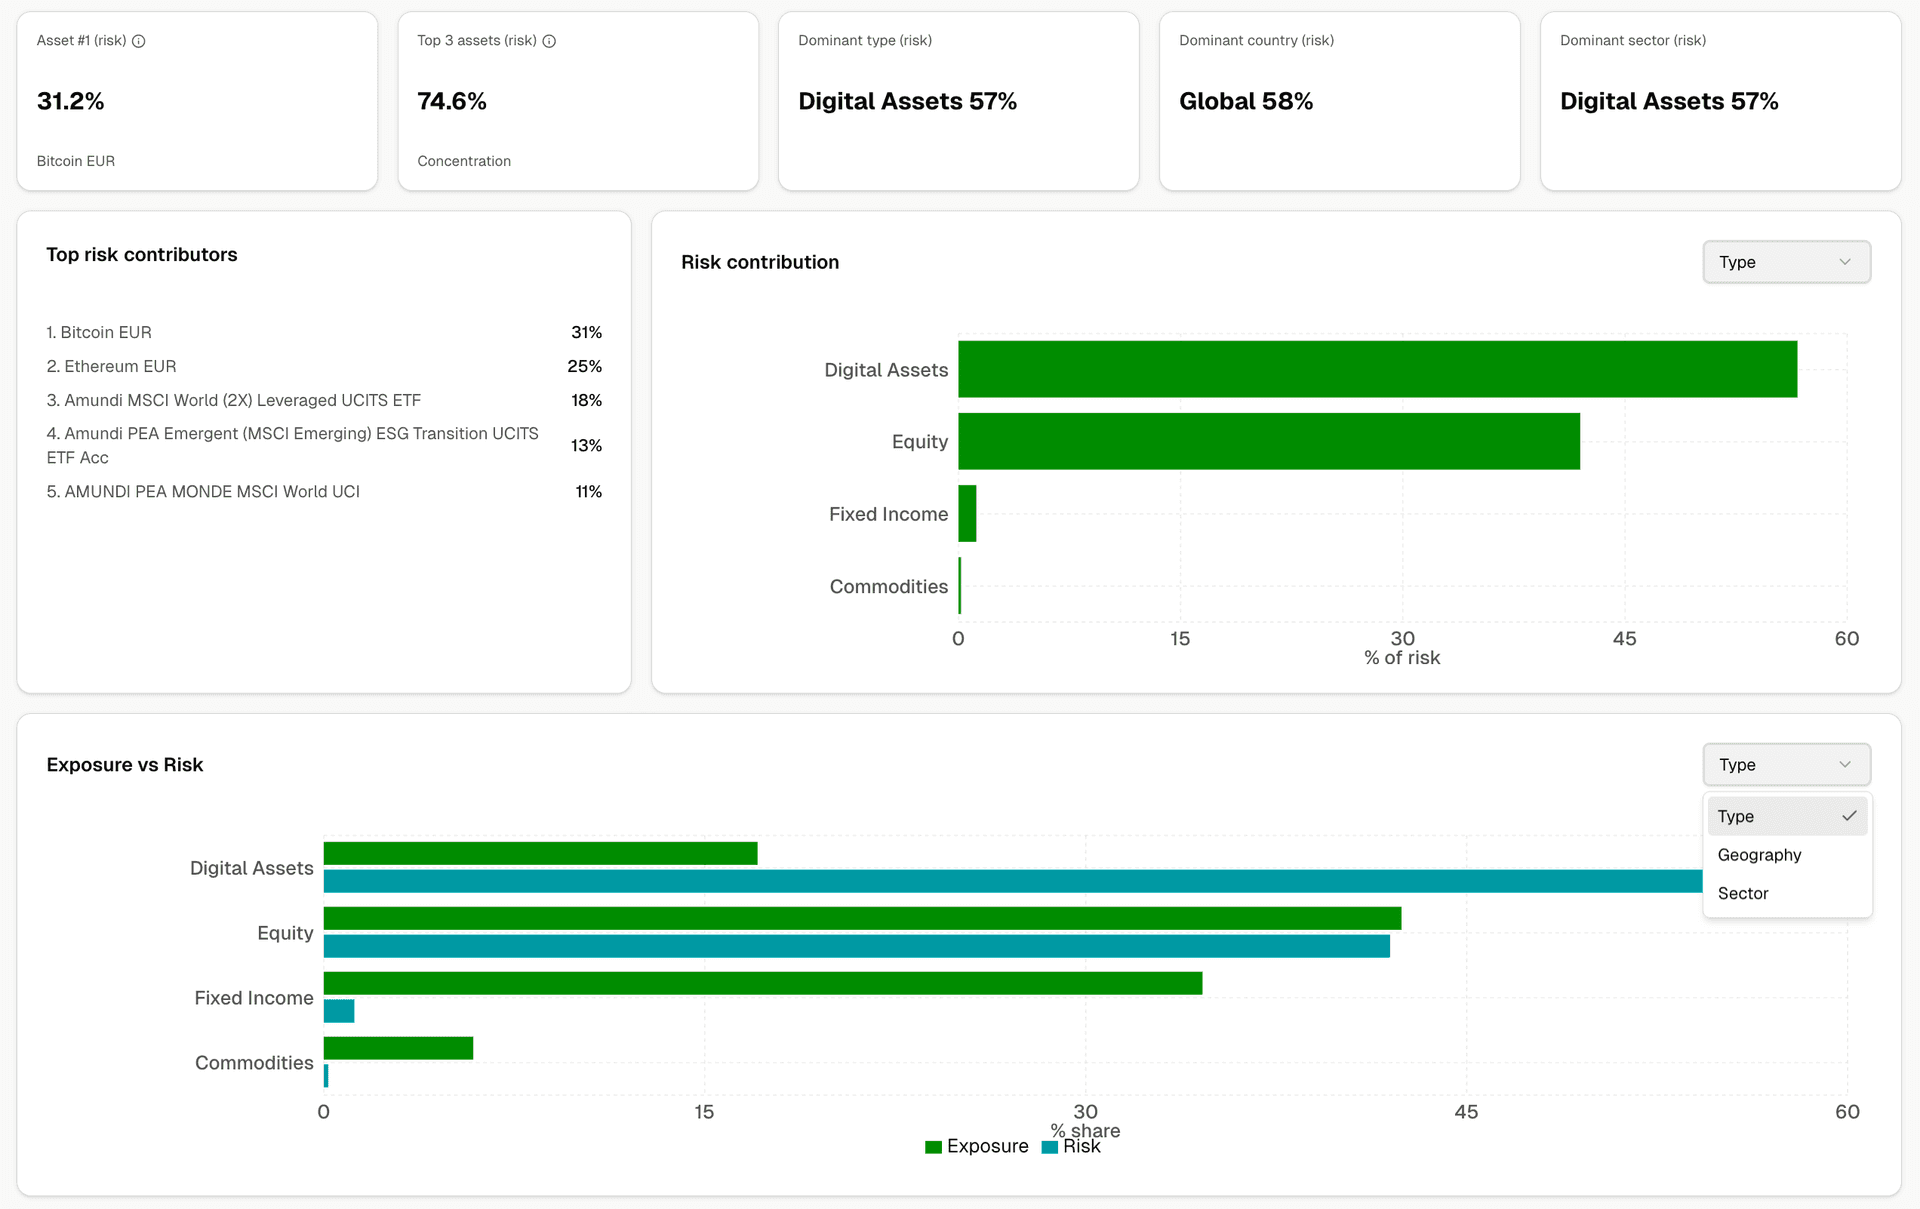
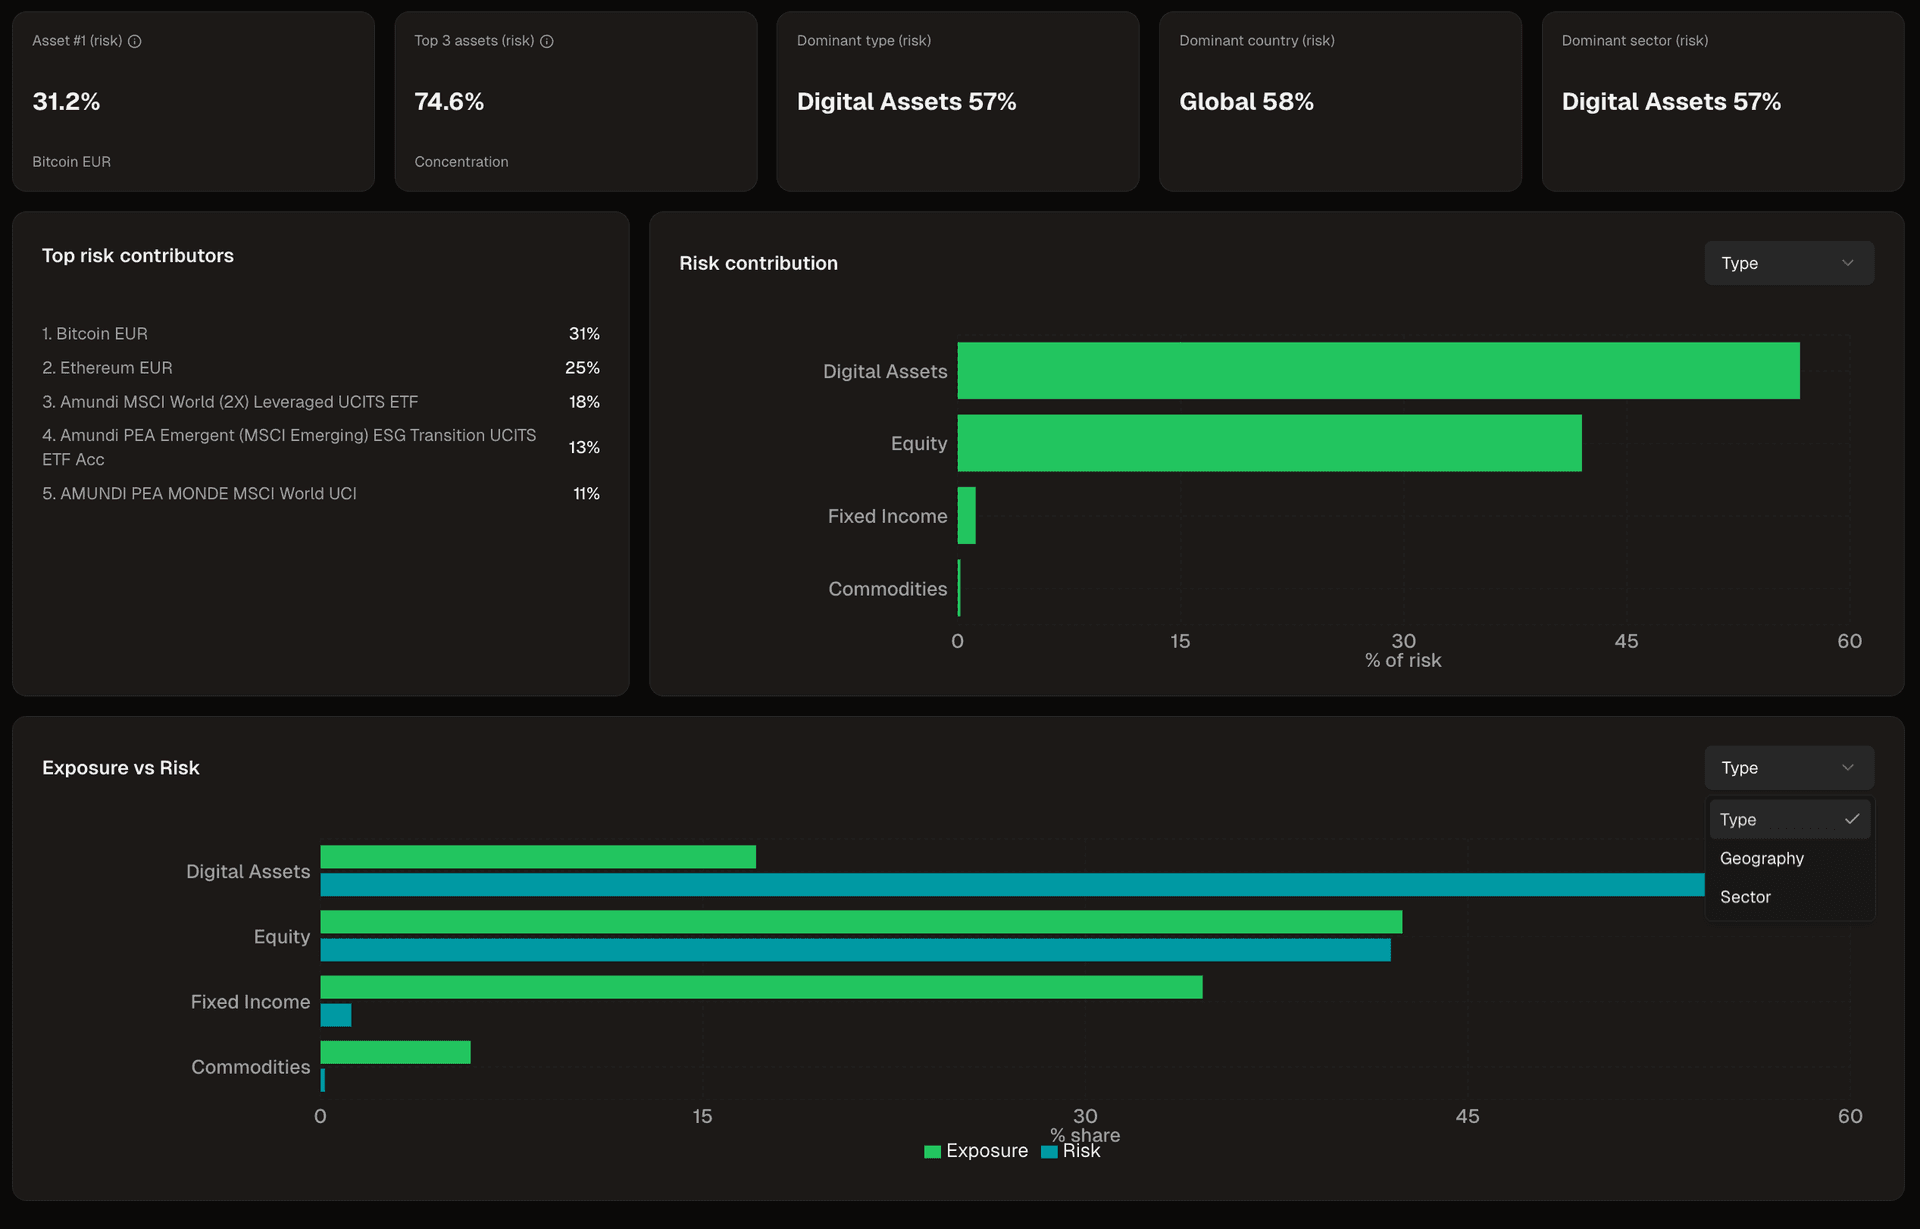
Concentration
where your risk truly lies
Measure each asset's true contribution to total risk. Detect hidden concentrations via Component VaR.
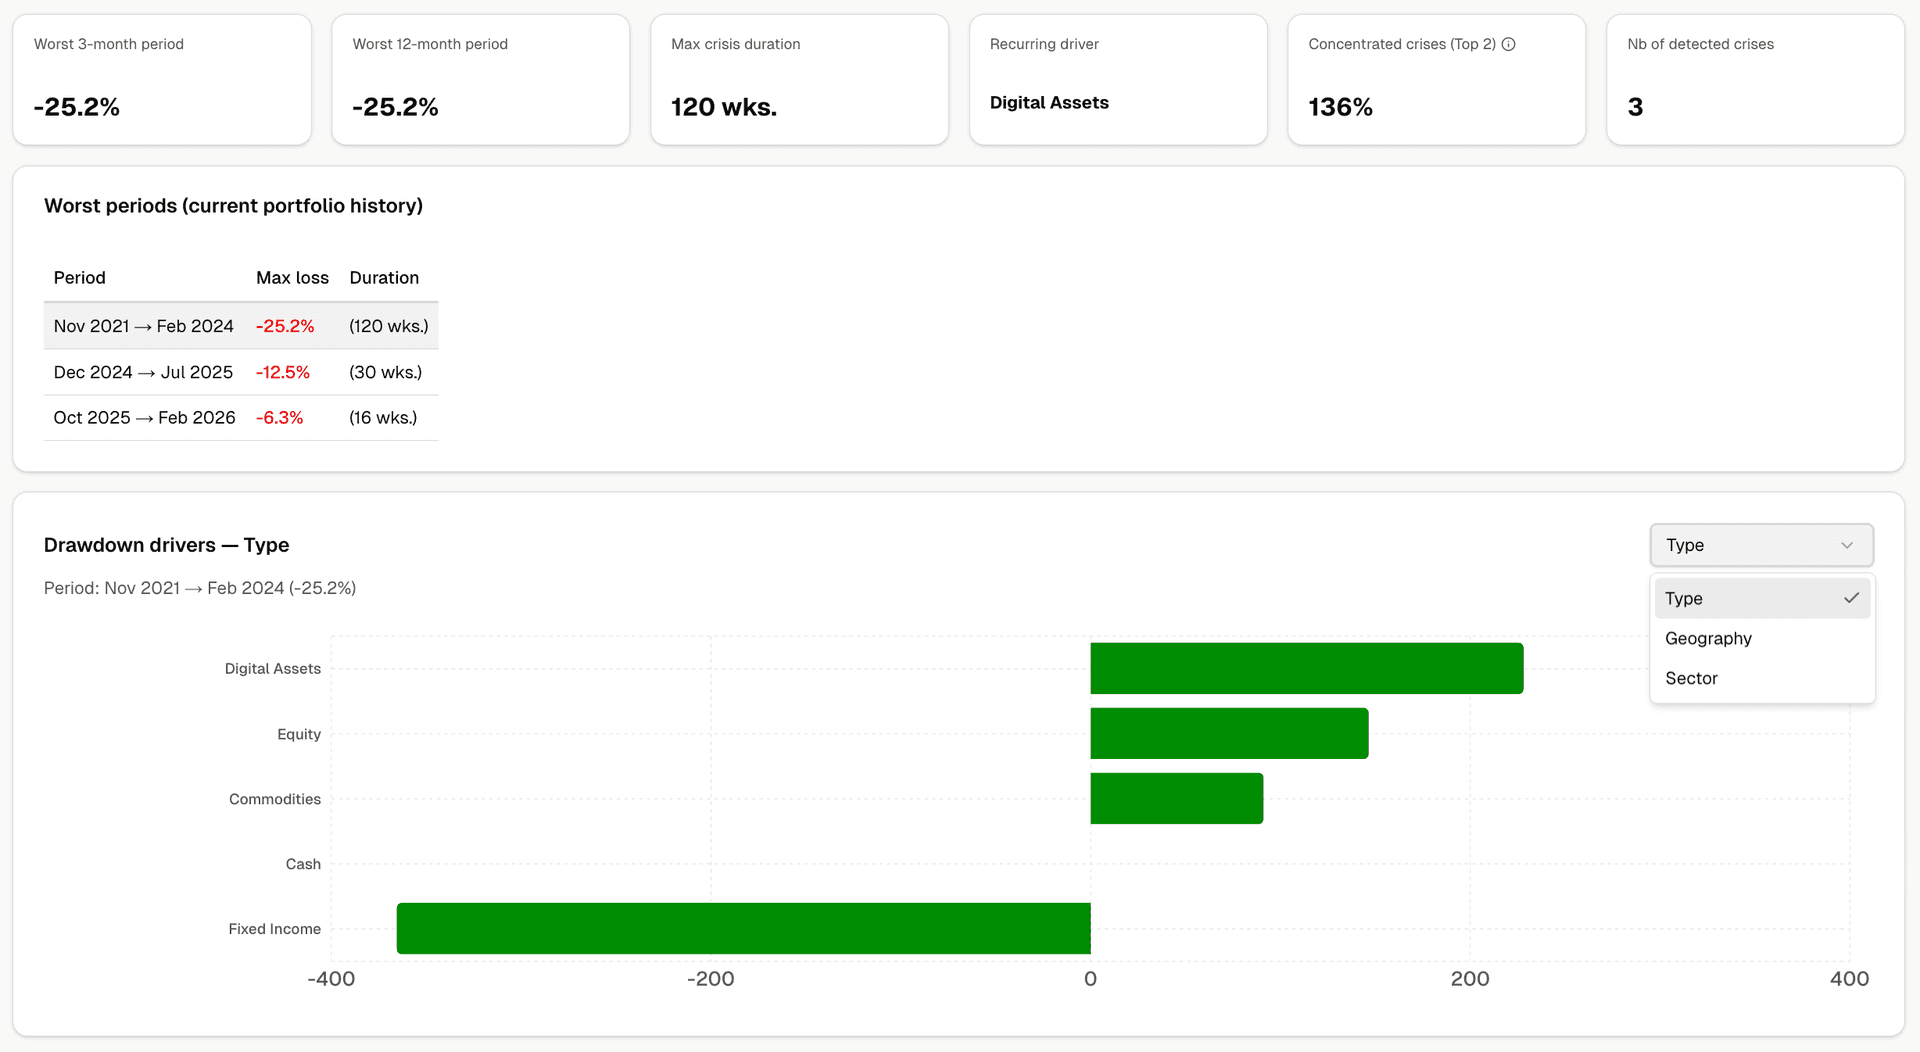
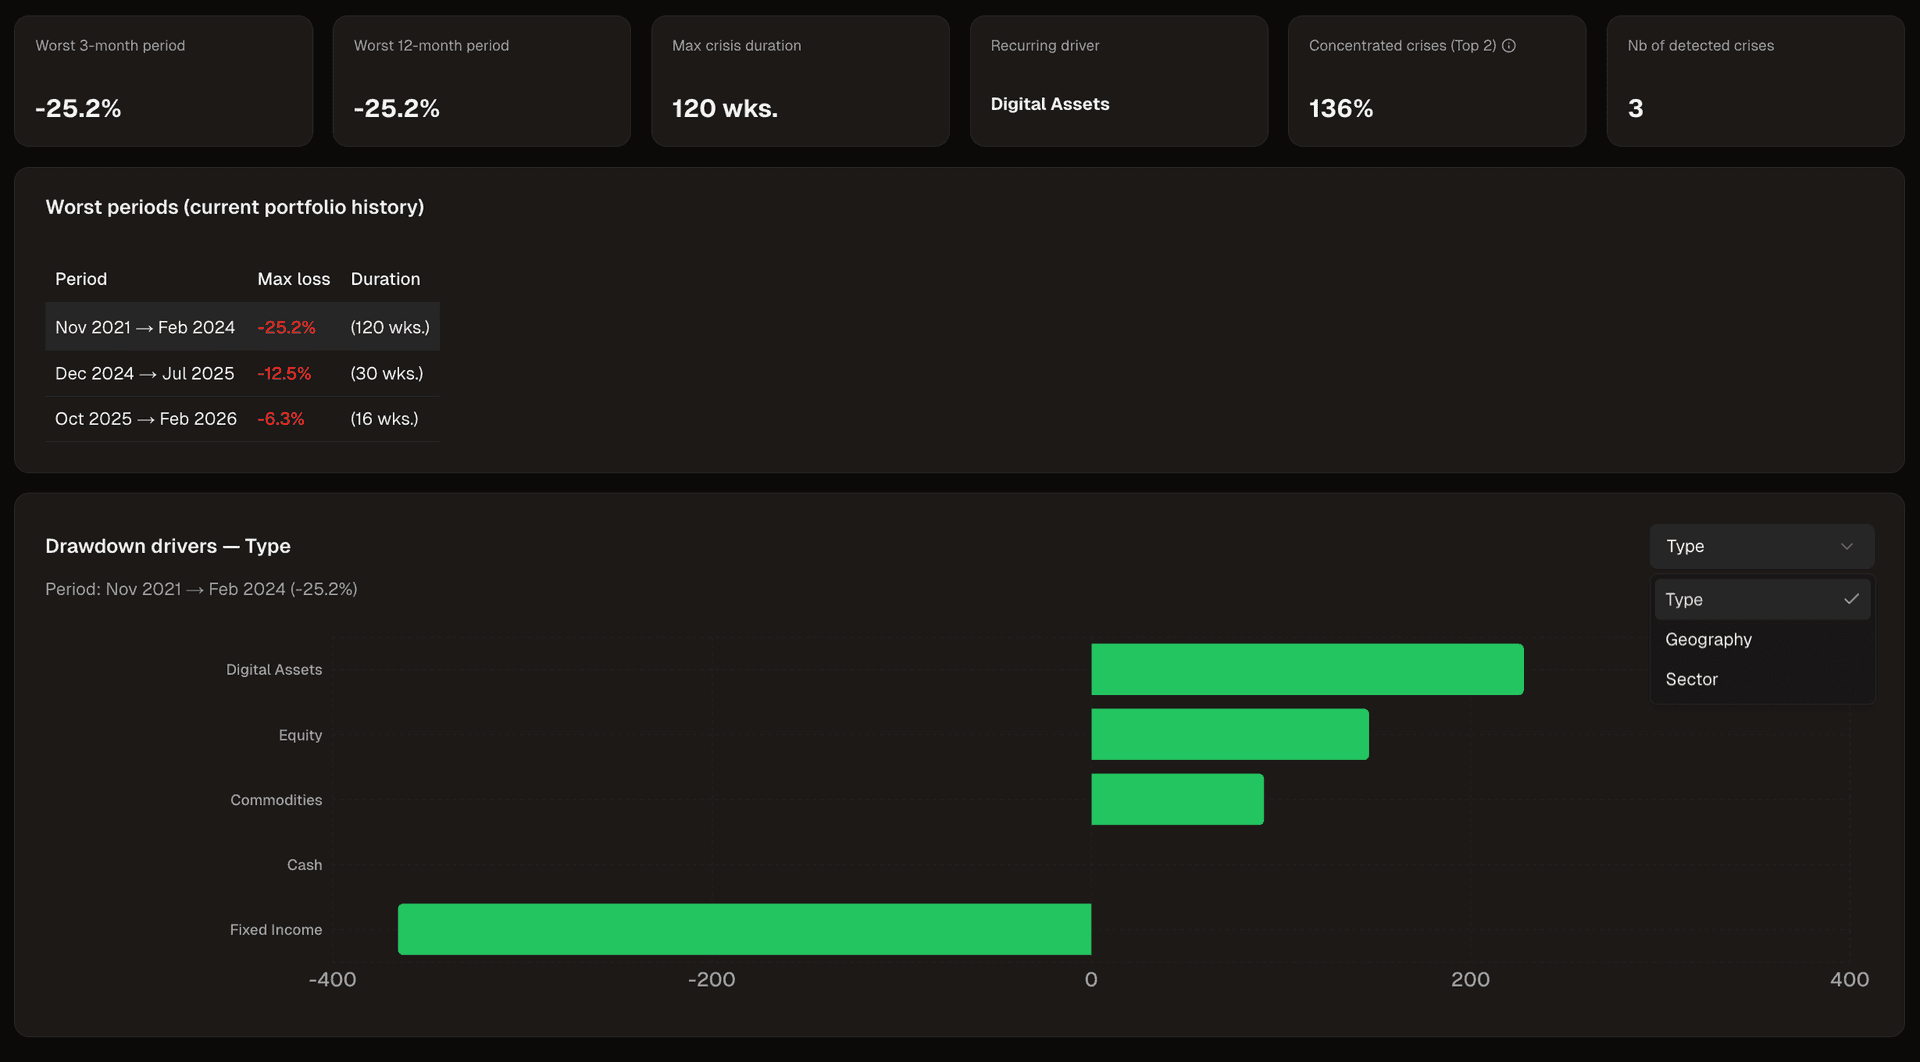
Crises
your worst periods, explained
Automatic crisis detection, recurring driver identification and analysis of your worst periods.
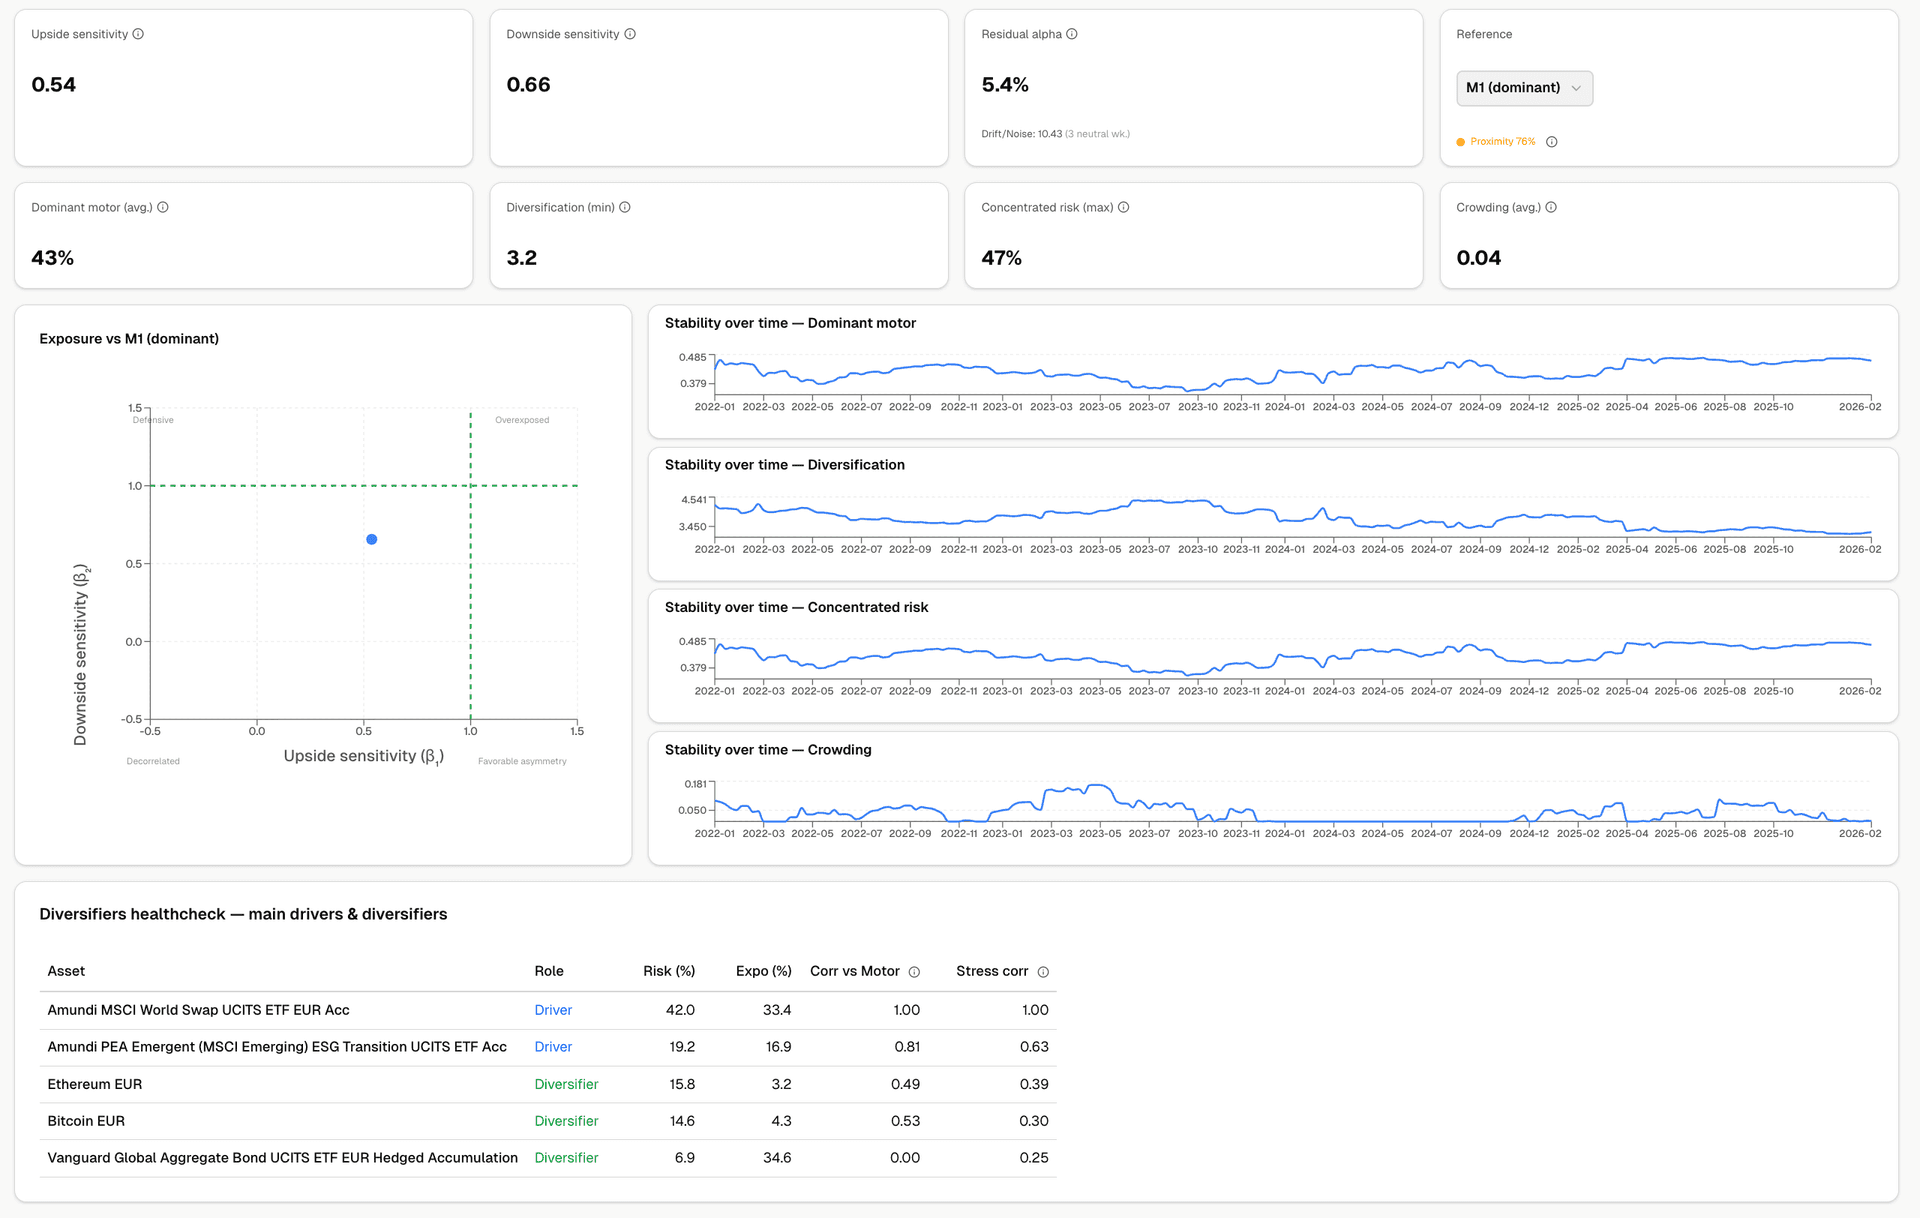
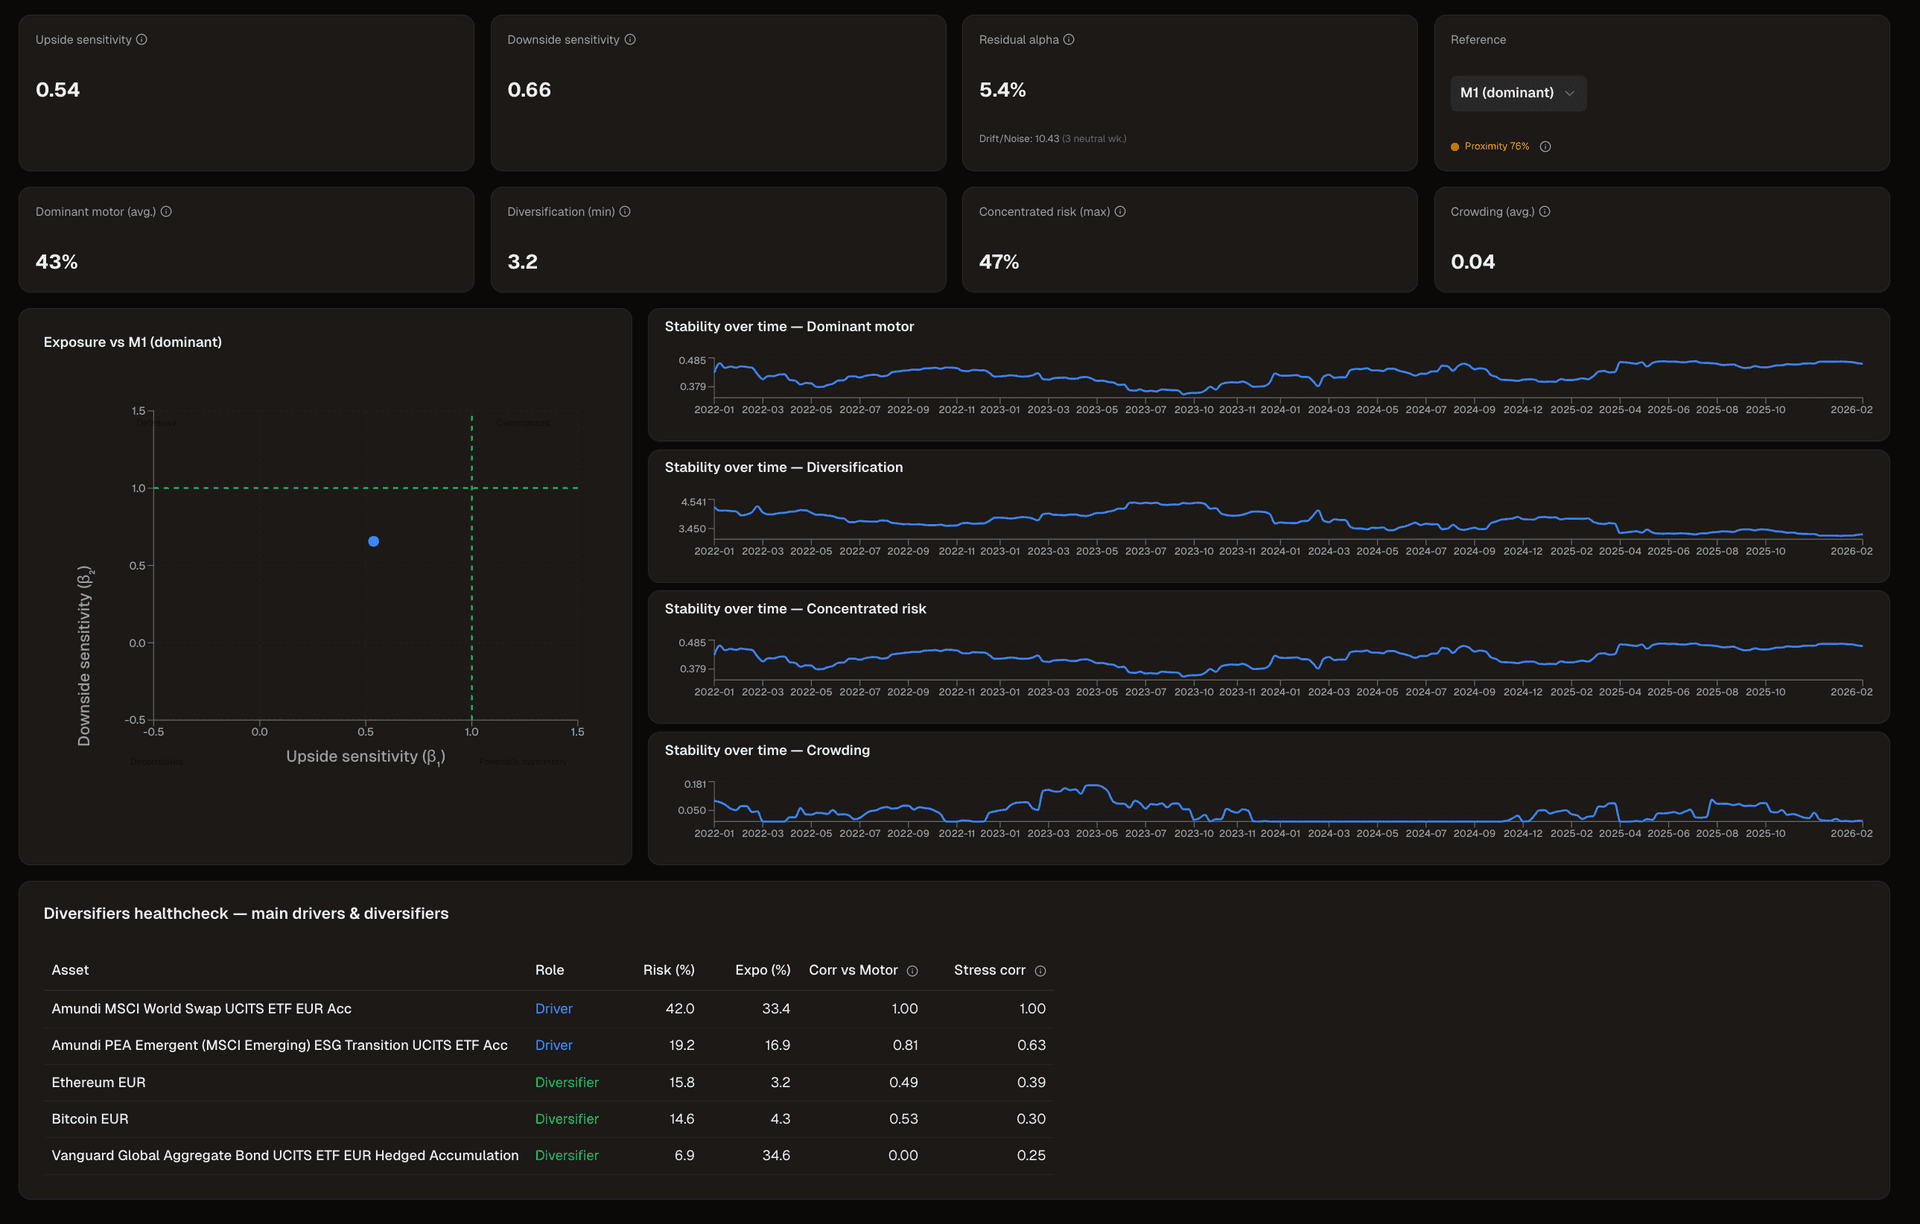
Stability
reliable diversifiers vs illusions
Upside/downside conditional beta, rolling stability and detection of false diversifiers.
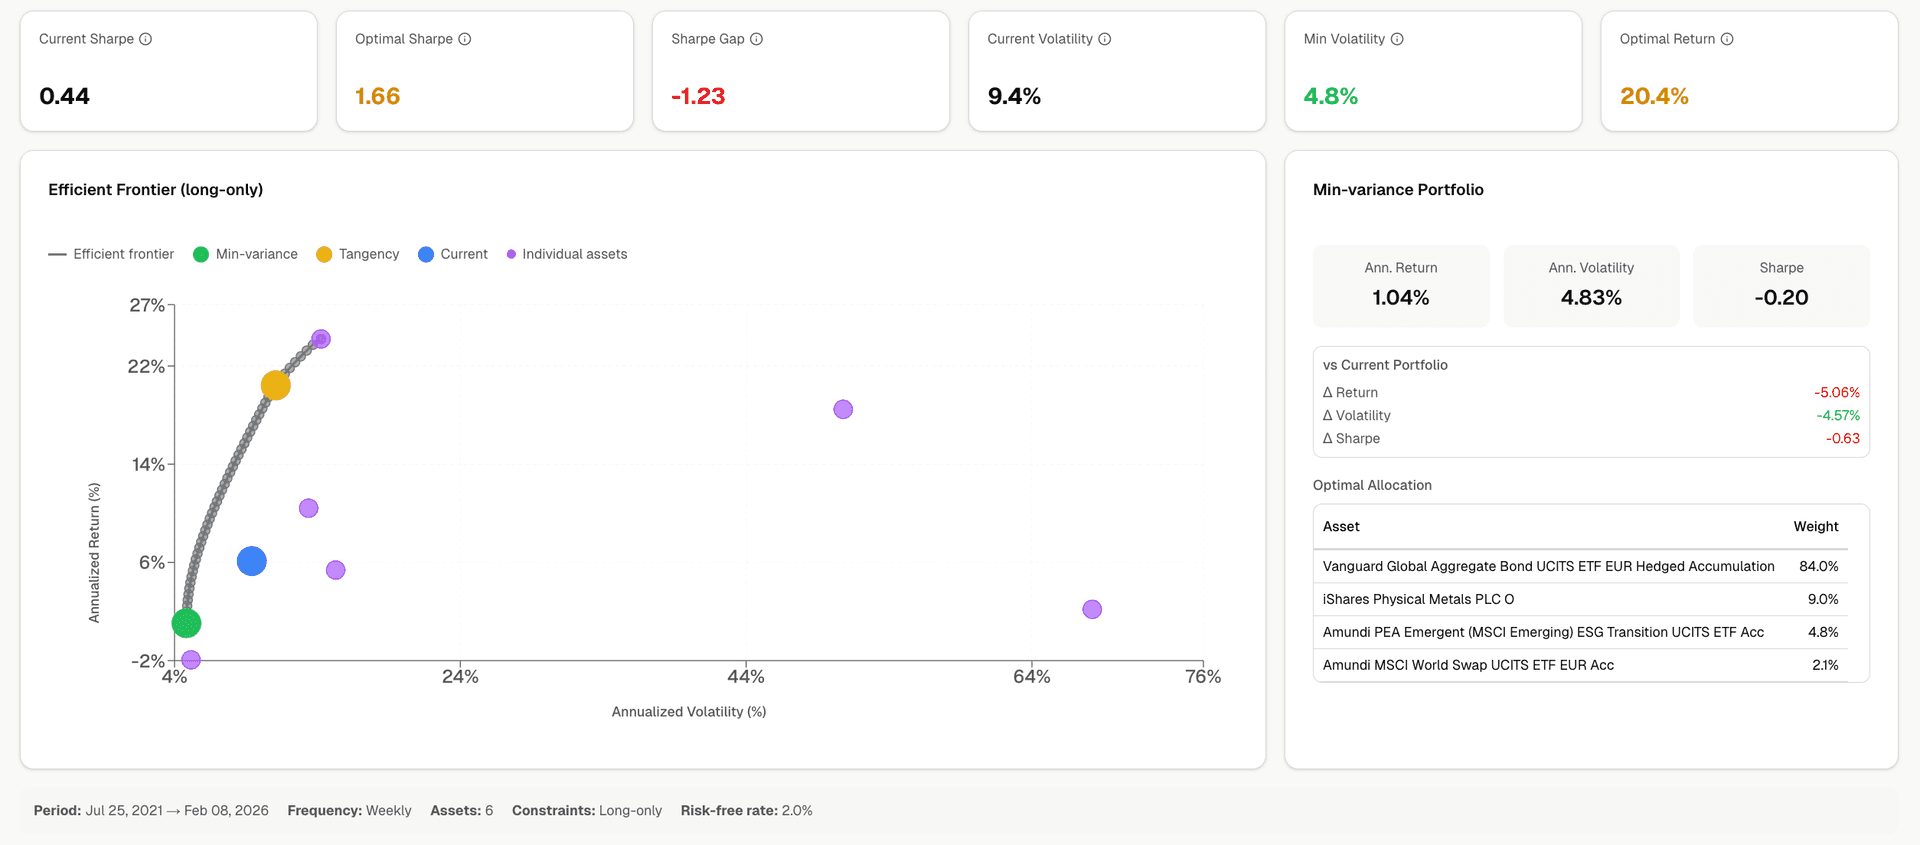
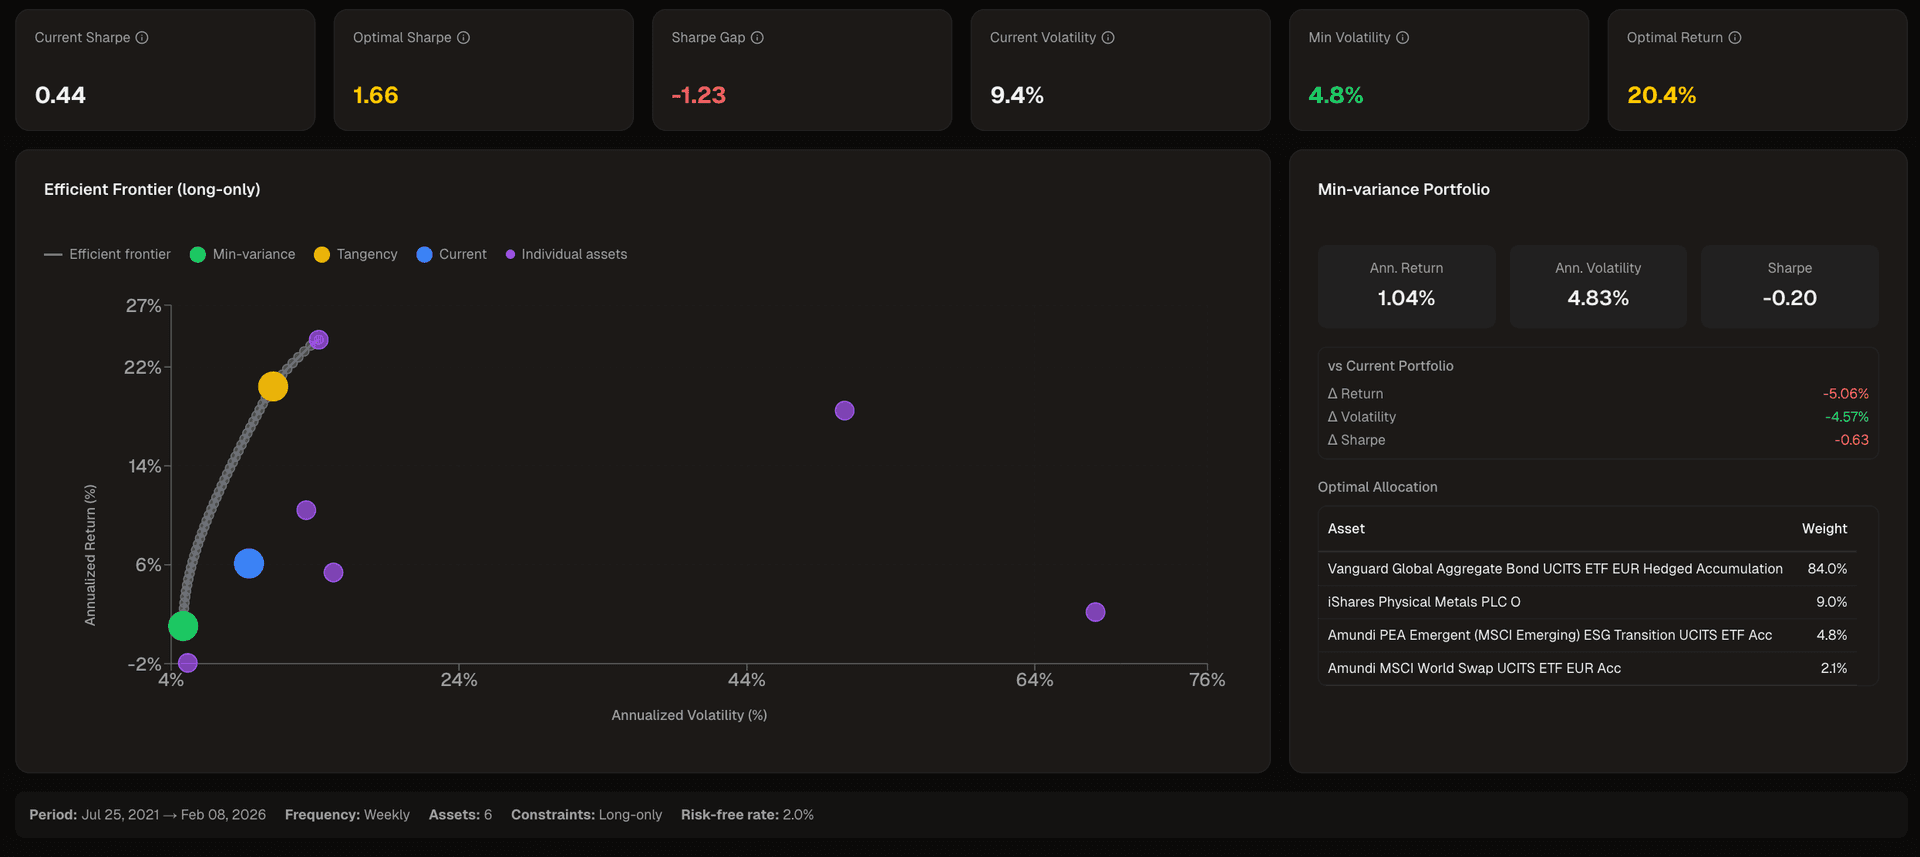
Efficiency
your Sharpe gap, actionable
Efficient frontier, tangency portfolio and Sharpe gap. See how much return you're leaving on the table.
Run your first diagnostic
Get startedFor you if…
- You have multiple assets or accounts
- You wonder "where is my risk really?"
- You know Sharpe, correlation, drawdown (at least by name)
- You're looking for a decision-making tool, not just reporting
- You want to make decisions (allocation, rebalancing), not just track
Probably not for you if…
- You're just looking for a monthly P&L
- You want a trading or market timing tool
- You want buy/sell signals or timing
Projections used in quantitative management.
Simulate any portfolio's evolution with models from quantitative finance.
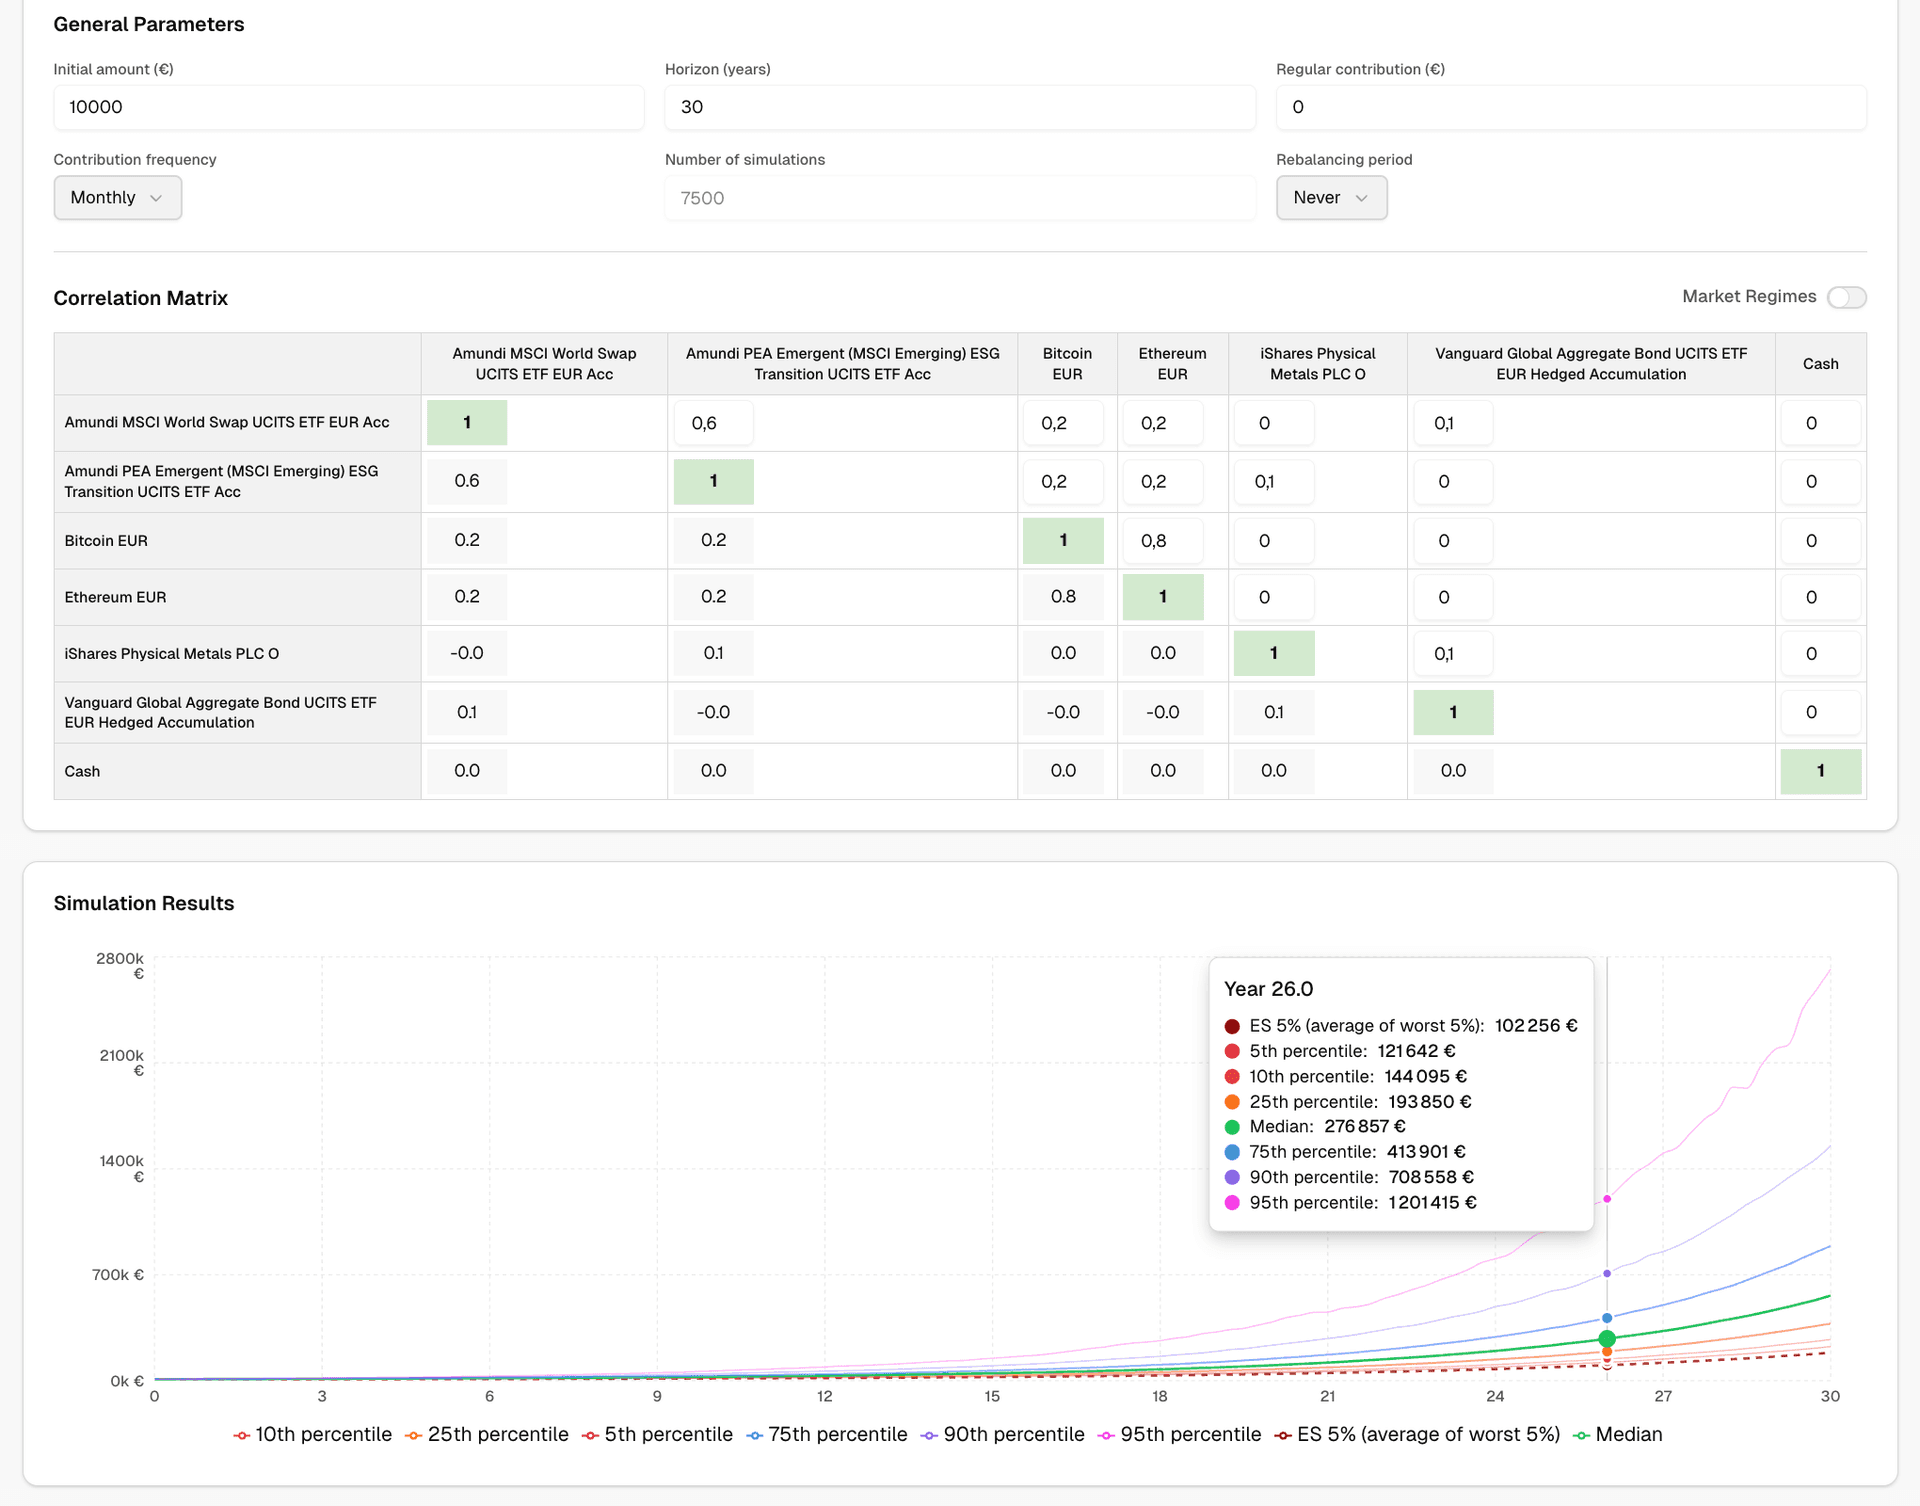
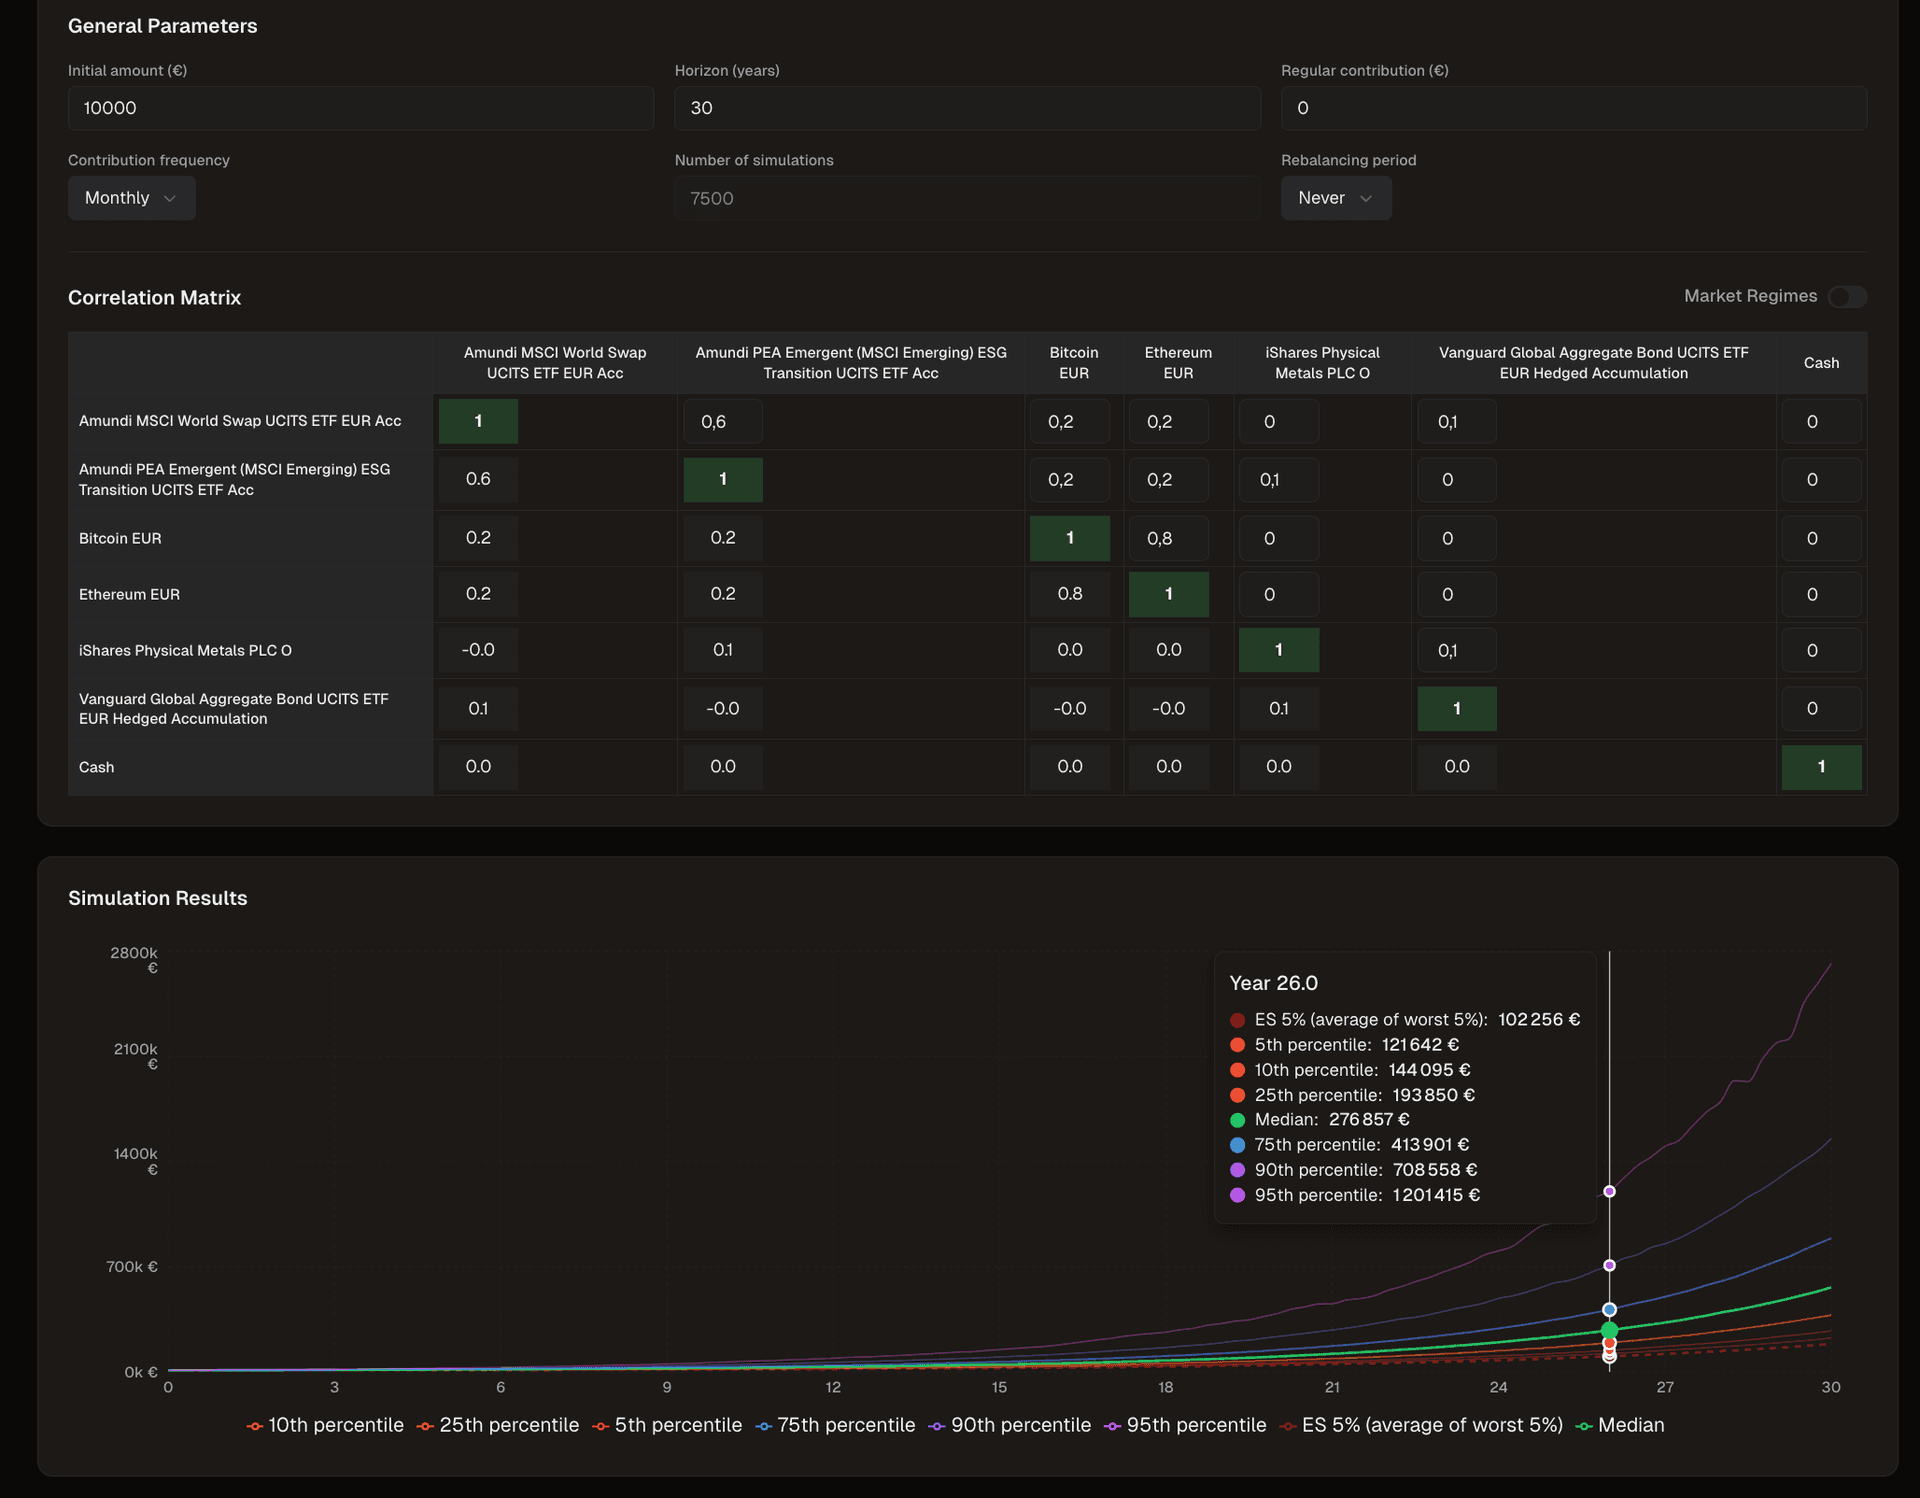
Multi-regime Monte Carlo
your portfolio across every scenario
- Market regimes (calm, volatile, stress)
- Custom correlations
- Stress tests and extreme scenarios
- Ruin probabilities / Expected Shortfall
- Automatic rebalancing
Quantitative rigor under the hood
The same methods used in institutional management.
A simple journey for a complete vision
From import to decision, in 4 steps.
Import your accounts
Create your portfolios or import from CSV (PortfolioPerformance).
Analyze your allocations
Structure by type, geography, sector and define your target.
Diagnose your risks
Run the multi-factor diagnostic on your portfolio.
Project and rebalance
Simulate with Monte Carlo and prepare your next rebalancing moves.